Software Instrumentation, Observability, and the Rise of OpenTelemetry
In this post, I aim to provide you with the theoretical understanding and history around software instrumentation, observability and OpenTelemetry. My next post will be a more technical one (Grafana Cloud integration via OpenTelemetry protocol), but for now, the basics.
To understand OpenTelemetry, you need to understand the problem it solves first.
Instrumentation
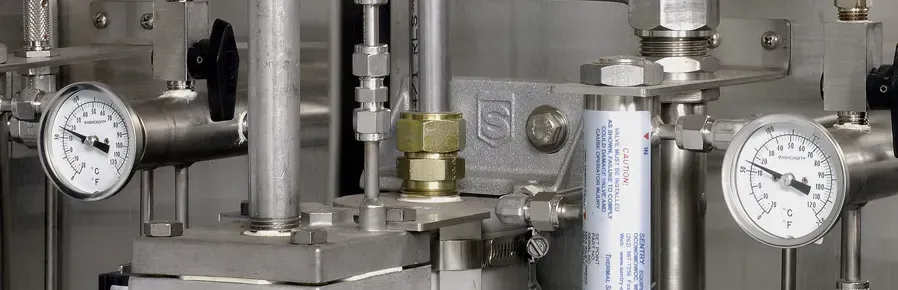
Instrumentation in our everyday lives is measuring and monitoring “physical quantities”. Thermostats, smoke detectors or even the fuel gauges in our cars are examples for real life instrumentation.
In the context of software, we’ve borrowed this term to refer to the techniques and tools used to monitor, measure, and gain insights into the behavior and performance of a system.
Software instrumentation involves:
Logs: Records of discrete events or operations that occur during application operation.Traces: Tracking requests as they flow through distributed systems, showing the path and timing of operations across multiple services.Metrics: Numerical measurements of system or application performance, such as response times, request rates, or memory usage.Profiling: Capturing detailed performance data about which parts of code are consuming the most resources (CPU, memory, etc.)
Logs, traces and metrics are considered as the “3 pillars of observability”, with profiling being a recent addition (OpenTelemetry announced support for the profiling signal only about a year ago). The main focus of software instrumentation is collecting real-time data from a system or service to improve its observability.
Observability
What do we do with the instrumented data? We observe it. Maintaining a software system involves observing its performance and behaviour.
If we can instrument a software system and pull useful data out of it, that system is “observable.” It’s a spectrum — the more insight you have, the more you can observe.
The observability attribute of a software system can help you answer questions about its behaviour, even ones you didn’t anticipate when you built it. You can never foresee every possibility when designing software.
💡 But how does it relate to “monitoring”?
Think of it this way: monitoring tells you when something is wrong, while observability helps you understand why it’s wrong and where the issue originates.
Back to the 3 pillars:
- Logs provide specific details about events/errors
- Traces reveal how requests flow through a distributed system
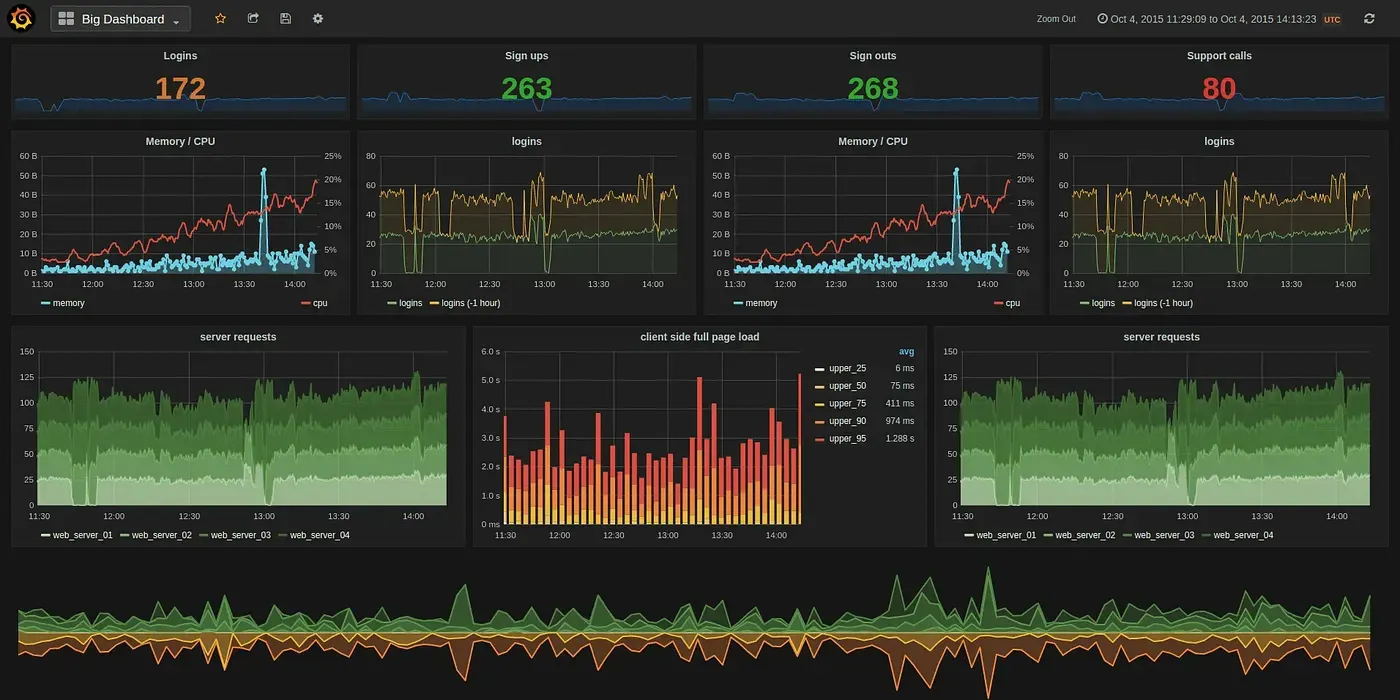
- Metrics give you the high-level view, showing trends and patterns across time
A truly observable system allows engineers to slice and dice this data to correlate across different dimensions, and quickly diagnose problems.
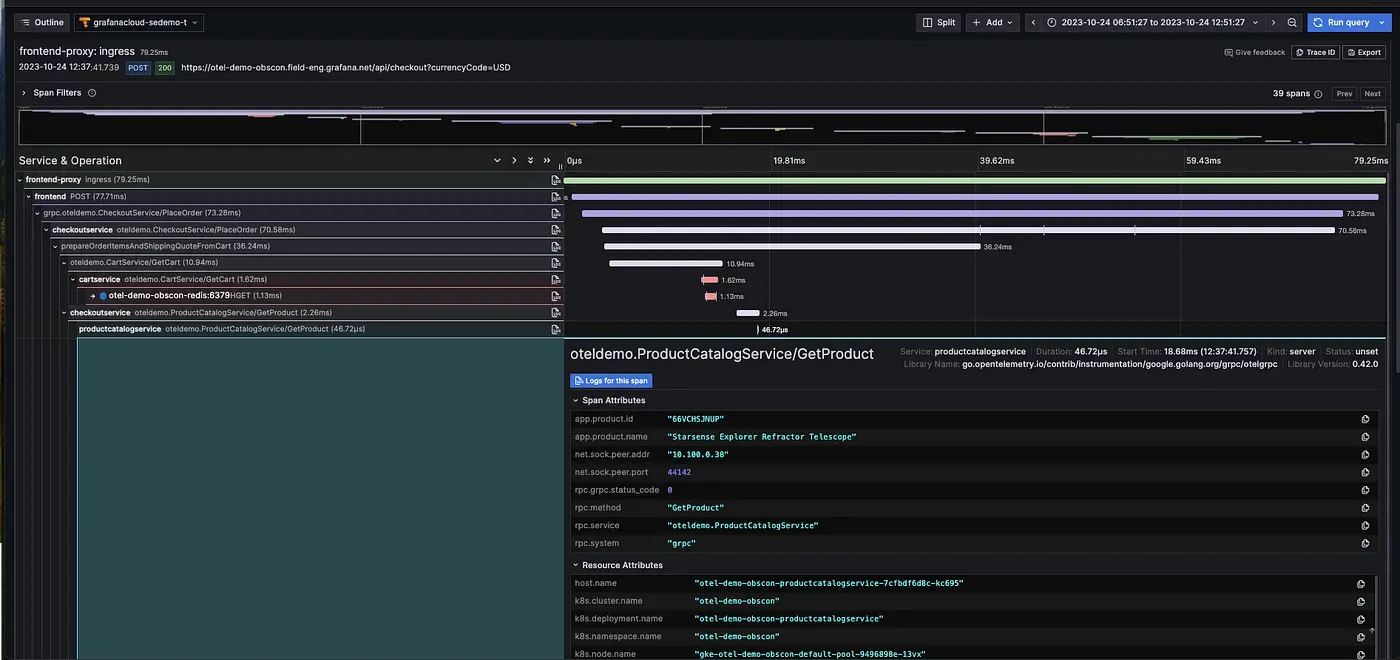
Observability is especially crucial in distributed systems, where a single request might touch many different services in the backend. Without it, debugging these systems is nearly impossible.
The Need for a Standard
With the rise of cloud computing, microservices architectures, and increasingly complex business requirements, the need for software and infrastructure observability was greater than ever. Every observability vendor had their own way of collecting and formatting this data, though, and the formats didn’t talk to each other.
Before OpenTelemetry, instrumenting your application meant making hard choices (vendor lock-in). For example, if you wanted to integrate with Datadog you would have to use the Datadog libraries, and if you wanted to switch to New Relic later you would have to rewrite your entire instrumentation code with New Relic’s libraries.
As the need for a vendor-neutral standard rose, OpenTelemetry stepped in.
The Rise of OpenTelemetry
![]()
OpenTelemetry (often abbreviated as OTel) emerged in 2019 from the merging of two competing open-source projects: OpenTracing and OpenCensus. The project joined Cloud Native Computing Foundation in 2019, and has grown to become the second most active CNCF project after Kubernetes.
OpenTelemetry’s purpose is to provide a vendor-neutral standard for generating, exporting and collecting telemetry data such as logs, traces and metrics. Because of this standard you can instrument your application once and send OTLP (OpenTelemetry Protocol) signals to any compatible backend you choose — Jaeger, Prometheus, and so on.
💡 OpenTelemetry can be defined as an “observability framework and toolkit”.
Standardization also means the community can build shared instrumentation libraries. When someone writes OpenTelemetry instrumentation for a popular tool, everyone benefits, regardless of which backend they’re using. Work compounds across the community instead of fragmenting across vendor-specific libraries.
From a management perspective, OpenTelemetry reduces risk. You’re no longer betting your observability strategy on a single vendor’s future. You pick whichever tools you want for observability, and the instrumentation in your code stays the same.